

Image Details
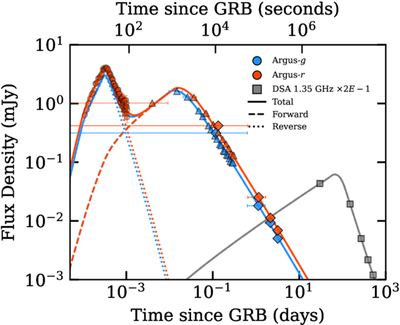
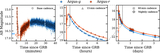
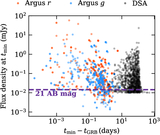
Caption: Figure 8.
The same model as in Figure 6 with simulated DSA observations, shown as gray squares. We plot the injected light curve including the reverse and forward-shock emission components. Simulated Argus observations with the baseline (second) cadence data are shown with circles, 15 minute cadence data are shown as triangles, and day-cadence data are shown with diamonds.
Other Images in This Article
Copyright and Terms & Conditions
© 2026. The Author(s). Published by the American Astronomical Society.

Copyright ©
2026 Astronomy Image Explorer. All Rights Reserved.
