

Image Details
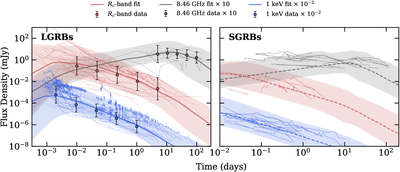
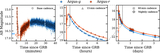
Caption: Figure 2.
Observed and model light curves for both SGRBs and LGRBs. Right panel: LGRB afterglow models resulting from the Markov Chain Monte Carlo fit in Figure 1 and described in Section 3.1.3. These are interpolated at specific time steps for 8.46 GHz, Rc-band, and 1 keV, and their distributions in log-space are shown as colored points, with error bars denoting their standard deviations. Left panel: SGRB models are drawn from a manually selected distribution of parameters. The thin lines denote individual observed light curves, and population models are shown with the thick colored lines denoting the log-mean flux density and the shaded regions denoting the 90% confidence interval.
Other Images in This Article
Copyright and Terms & Conditions
© 2026. The Author(s). Published by the American Astronomical Society.

