

Image Details
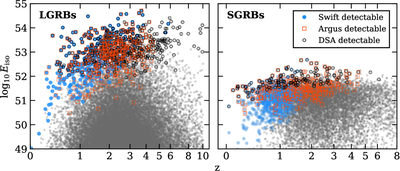
Caption: Figure 5.
Isotropic-equivalent energy release versus redshift for our population of synthetic GRBs. The left panel shows the LGRB population and the right panel shows the SGRB population. The gray points indicate all simulated GRBs, the blue circles indicate GRBs detected with Swift/BAT, the orange squares indicate GRBs with afterglows detected with Argus, and the black rings indicate GRBs with afterglows detected with DSA.
Other Images in This Article
Copyright and Terms & Conditions
© 2026. The Author(s). Published by the American Astronomical Society.

Copyright ©
2026 Astronomy Image Explorer. All Rights Reserved.
