

Image Details
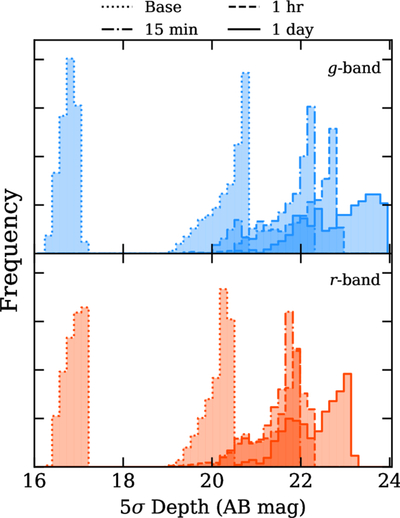
Caption: Figure 3.
Distribution of simulated depths in Argus g and r-band for a the baseline cadence in addition to observations stacked at 15 minute, 1 hr, and day duration intervals. The y-axis shows the density of observations at each depth bin and cadence, in arbitrary units. The baseline cadence includes second-cadence observations in bright time with median depths of g = 16.8 and r = 16.9 AB mag and minute-cadence data in dark and gray time with depths of g = 20.5 and r = 20.2 AB mag.
Other Images in This Article
Copyright and Terms & Conditions
© 2026. The Author(s). Published by the American Astronomical Society.

Copyright ©
2026 Astronomy Image Explorer. All Rights Reserved.
