

Image Details
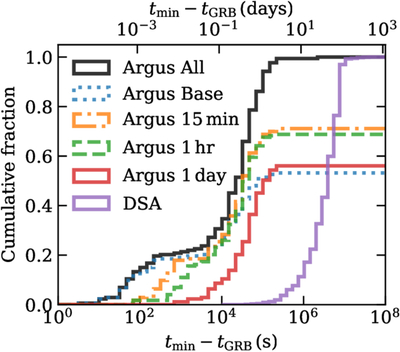
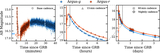
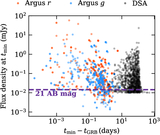
Caption: Figure 7.
Cumulative distributions of the time between an LGRB detection and the first detection of its afterglow. Distributions are shown for each Argus cadence analyzed in this work; baseline (1 s and 1 minutes), 15 minutes, 1 hr and 1 day in addition to DSA and are expressed as a fraction of the total number of simulated detections.
Other Images in This Article
Copyright and Terms & Conditions
© 2026. The Author(s). Published by the American Astronomical Society.

Copyright ©
2026 Astronomy Image Explorer. All Rights Reserved.
