

Image Details
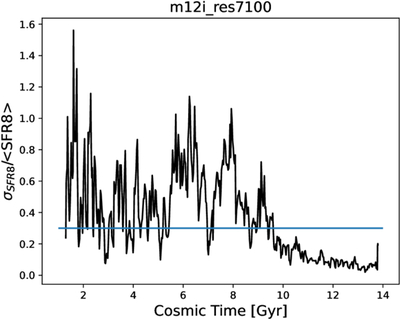
Caption: Figure 7.
Normalized moving standard deviation over m12i’s SFH. The variance is calculated over the previous 100 Myr, for each analyzed snapshot. The standard deviation is normalized by the moving SFR average. The horizontal blue line denotes our adopted turnover threshold of 0.3 from bursty to smooth star formation that is motivated by the commonly accepted scatter of the observed SFMS.
Other Images in This Article
Copyright and Terms & Conditions
© 2026. The Author(s). Published by the American Astronomical Society.

Copyright ©
2026 Astronomy Image Explorer. All Rights Reserved.
