

Image Details
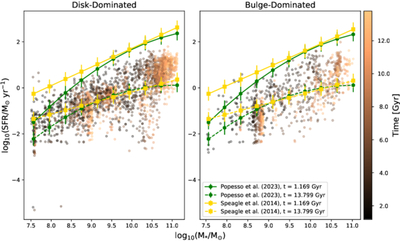
Caption: Figure 5.
SFMS relation for all galaxies analyzed. In the left panel, snapshots where galaxies have n < = 2.5 are shown, whereas the right panel shows snapshots where n > 2.5. Comparisons to observed SFMSs are displayed with colored lines. Solid lines indicate the SFMS calculated at the earliest age of the Universe analyzed, and dashed lines show the expected SFMSs at z = 0.0. Error bars show the accepted scatter of 0.3 dex.
Other Images in This Article
Copyright and Terms & Conditions
© 2026. The Author(s). Published by the American Astronomical Society.

Copyright ©
2026 Astronomy Image Explorer. All Rights Reserved.
