

Image Details
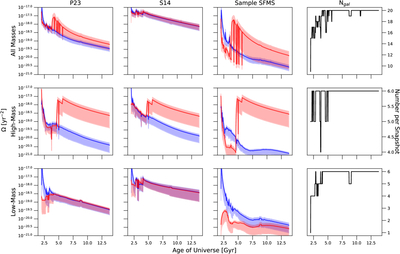
Caption: Figure 9.
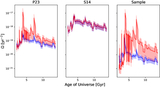
TM metric over cosmic time across our sample for SFMS deviations. In the first three columns, the TM metric based on SFMS deviations over cosmic time is shown for the three SFMSs considered in this work. Red lines denote SFR deviations on long timescales (800 Myr; sSFR9), and blue lines are for short timescales (∼20–25 Myr; sSFR7). The rightmost column contains the number of galaxies considered at each snapshot. Galaxies may not be considered during a snapshot as a result of a lack of star formation and/or because the halo was not captured by the analysis code. The top row of panels corresponds to the whole sample, and the middle and bottom rows show the TM metric behavior when only the six highest- and lowest-mass systems are considered, respectively. Logarithmic axes for the TM metric are used to improve clarity.
Other Images in This Article
Copyright and Terms & Conditions
© 2026. The Author(s). Published by the American Astronomical Society.

