

Image Details
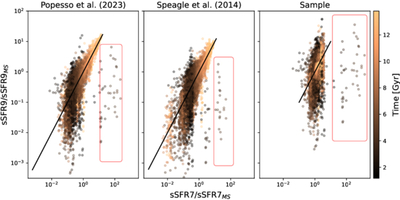
Caption: Figure 6.
Comparison between SFMS deviations on long (SFR9) and short timescales (SFR7). Black lines indicate equivalence. Red boxes surround outlier points from a Milky Way–Andromeda pair. SFMS deviations are plotted logarithmically for comparison with the SFMS.
Other Images in This Article
Copyright and Terms & Conditions
© 2026. The Author(s). Published by the American Astronomical Society.

Copyright ©
2026 Astronomy Image Explorer. All Rights Reserved.
