

Image Details
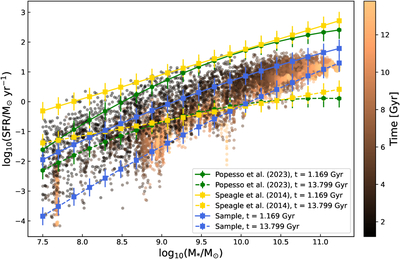
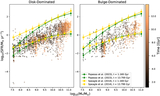
Caption: Figure 1.
SFMS relation for all galaxies analyzed. Simulation results are plotted for all z = 4.0 to z = 0.0 values. The expected SFMSs from P. Popesso et al. (2023) and J. S. Speagle et al. (2014) are displayed in green and yellow, respectively. The SFMS constructed from the FIRE-2 data is shown in blue. Solid lines indicate the SFMSs calculated at z = 4.0, and dashed lines show the expected SFMSs at z = 0.0. Error bars show the accepted scatter of 0.3 dex.
Other Images in This Article
Copyright and Terms & Conditions
© 2026. The Author(s). Published by the American Astronomical Society.

Copyright ©
2026 Astronomy Image Explorer. All Rights Reserved.
