

Image Details
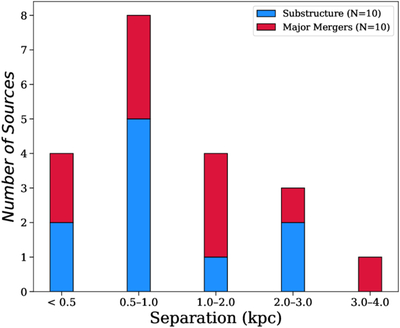
Caption: Figure 10.
Distribution of nuclear separations for all 20 systems in the Primary Keck AO Merger Sample with detected NIR substructure. The red bars indicate the subset of 10 systems with flux ratios consistent with a major merger (fsecondary/fprimary > 0.25; see Section 4.1), while the blue bars correspond to the remaining 10 targets with substructure that do not meet the major-merger criteria. This figure quantifies the spatial scale of the nuclear substructure revealed by Keck AO imaging and demonstrates that the SDSS/WISE offset selection method identifies compact nuclear pairs across a range of separations from ∼0﹩\mathop{.}\limits^{{\unicode{x02033}}}﹩2 to ∼1﹩\mathop{.}\limits^{{\unicode{x02033}}}﹩25 (176 pc–3.85 kpc), including systems consistent with major mergers.
Other Images in This Article
Show More
Copyright and Terms & Conditions
© 2026. The Author(s). Published by the American Astronomical Society.

