Image Details
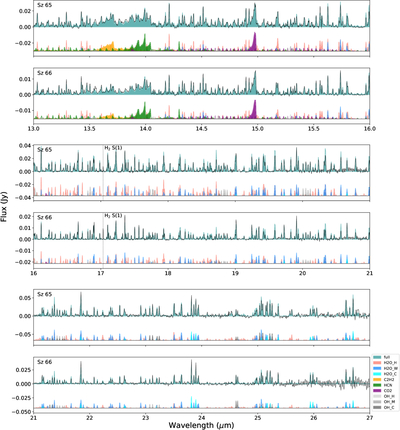
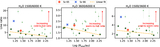
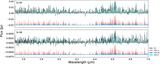
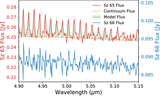
Caption: Figure 7.
The best-fit models and the continuum-subtracted spectra (black) of the primary Sz 65 and the secondary Sz 66 in the 13–27 μm range. The total model flux is shown in cyan in the upper axis, while the molecular contributions are shown in the lower axis. The H2 line, not included in the model, is indicated separately.
Other Images in This Article
Show More
Copyright and Terms & Conditions
© 2026. The Author(s). Published by the American Astronomical Society.
Copyright ©
2026 Astronomy Image Explorer. All Rights Reserved.