Image Details
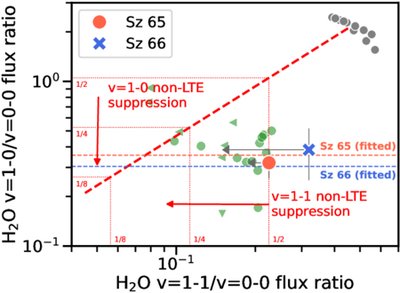
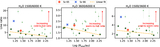
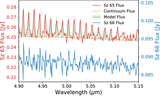
Caption: Figure 5.
Line diagnostic diagram for non-LTE suppression. Triangles and gray arrows indicate upper limits of undetected non-LTE lines for reference disks and the studied binary, respectively. The gray dots show LTE-predicted ratios, and the red dashed line denotes the level of suppression. Horizontal dashed lines indicate the best-fit suppression factors obtained in Section 3.2.2. See Figure 7 in A. Banzatti et al. (2025) for details.
Other Images in This Article
Show More
Copyright and Terms & Conditions
© 2026. The Author(s). Published by the American Astronomical Society.
Copyright ©
2026 Astronomy Image Explorer. All Rights Reserved.