Image Details
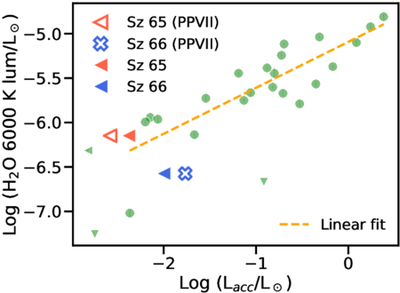
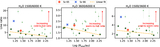
Caption: Figure 6.
Line diagnostics diagram showing accretion luminosity derived from mid-IR H I lines vs. the 6000 K line luminosity. Triangles indicate upper limits. For Sz 65 and Sz 66, the accretion luminosities reported in C. F. Manara et al. (2023, PPVII) derived from Balmer-jump fitting are shown with hollow marks. The correlation (orange) is fitted from reference disks with upper limits excluded.
Other Images in This Article
Show More
Copyright and Terms & Conditions
© 2026. The Author(s). Published by the American Astronomical Society.
Copyright ©
2026 Astronomy Image Explorer. All Rights Reserved.