Image Details
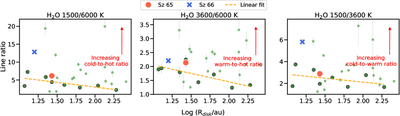
Caption: Figure 4.
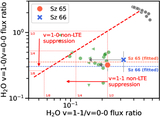
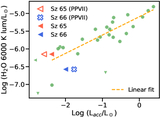
Line diagnostic diagrams showing line ratios vs. the dust disk size R90. The three line pairs represent the flux ratio of cold/hot (left), warm/hot (middle), and cold/warm (right) H2O. The anticorrelation (orange) is fitted from a subset of single stars without cloud contamination or a disk cavity (black outline). See Figure 13 in A. Banzatti et al. (2025) for details.
Other Images in This Article
Show More
Copyright and Terms & Conditions
© 2026. The Author(s). Published by the American Astronomical Society.
Copyright ©
2026 Astronomy Image Explorer. All Rights Reserved.