Image Details
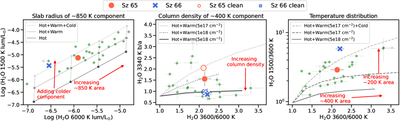
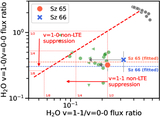
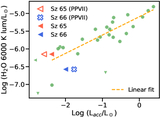
Caption: Figure 3.
Line diagnostic diagrams for Sz 65 and Sz 66, together with reference disks from A. Banzatti et al. (2025, green) and slab-model predictions (gray). Values for reference disks are updated to JDISCS version 9.0 (see Section 2.2 of P. Mallaney et al. 2026). Left: the radius of the hot (850 K) component increases from left to right with the 6000 K line luminosity, and the warm and cold components increase from bottom to top with the 1500 K line luminosity. Middle: the warm component increases from left to right, and the column density decreases from bottom to top. Hollow symbols indicate line ratios after removing organic contamination. Right: the warm component increases from left to right, and the cold component increases from bottom to top. See Figure 10 in A. Banzatti et al. (2025) for related details.
Other Images in This Article
Show More
Copyright and Terms & Conditions
© 2026. The Author(s). Published by the American Astronomical Society.