Image Details
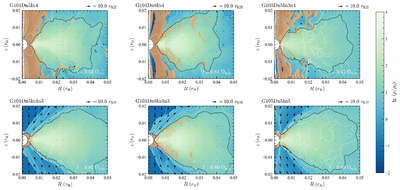
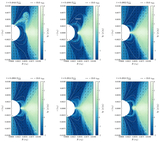
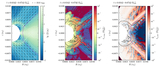
Caption: Figure 21.
Identification of MRI-active regions in our CPDs. Shown are the density distribution (color scale), poloidal velocity field (black arrows), and magnetic field lines (solid white lines). The scale of the poloidal velocity is shown at the top right of each panel, and the magnetic field lines are depicted by the contours of the poloidal magnetic flux at several specific levels. The black dashed lines indicate the contours of the critical density ﹩{\rho }_{{\rm{crit}}}=100\,{\rho }_{{\rm{\inf }}}﹩. The translucent sandy-brown shading highlights regions where the Lundquist number Lu > 1 (see the main text for the definition).
Other Images in This Article
Show More
Copyright and Terms & Conditions
© 2026. The Author(s). Published by the American Astronomical Society.