Image Details
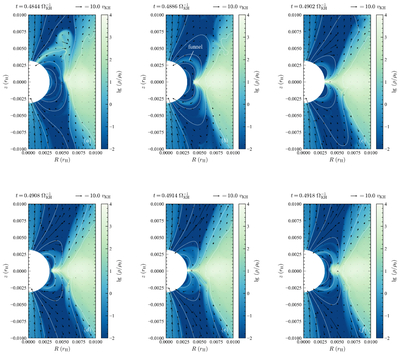
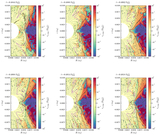
Caption: Figure 4.
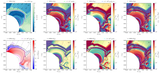
Snapshots of the typical accretion process from the disk inner edge to the planet for simulation G101Dn5In4 when the unlimited outflows are generated. Panels (a)–(f) show the progression over time, with the corresponding time indicated at the top left of each panel. The density distribution (color scale), poloidal velocity field (black arrows), and magnetic field lines (solid white lines) are shown. The scale of the poloidal velocity is shown at the top right of each panel, in units of vKH. For reference, the escape velocity at the planetary radius (rpl = 0.0027 rH) is vesc = 27vKH. The magnetic field lines are depicted by the contours of the poloidal magnetic flux at several specific levels.
Other Images in This Article
Show More
Copyright and Terms & Conditions
© 2026. The Author(s). Published by the American Astronomical Society.