Image Details
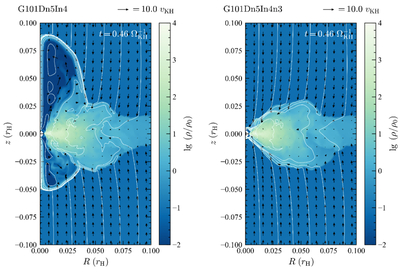
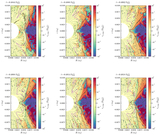
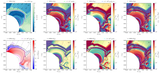
Caption: Figure 3.
Snapshots of simulations G101Dn5In4 (left) and G101Dn5In4n3 (right) at ﹩t=0.46\,{{\rm{\Omega }}}_{{\rm{KH}}}^{-1}﹩. The density distribution (color scale), poloidal velocity field (black arrows), and magnetic field lines (solid white lines) are shown. The scale of the poloidal velocity is shown at the top right of each panel. The magnetic field lines are depicted by the contours of the poloidal magnetic flux at several specific levels.
Other Images in This Article
Show More
Copyright and Terms & Conditions
© 2026. The Author(s). Published by the American Astronomical Society.
Copyright ©
2026 Astronomy Image Explorer. All Rights Reserved.