Image Details
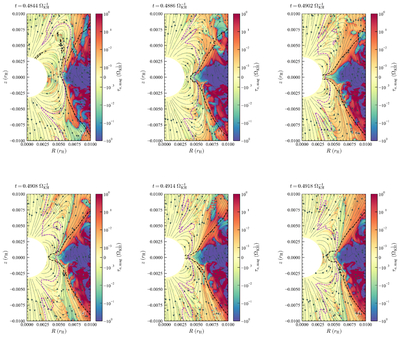
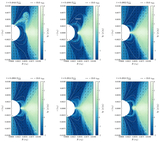
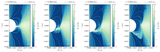
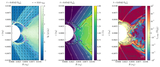
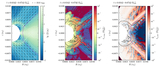
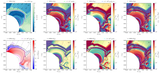
Caption: Figure 5.
Distributions of τa,mag (color scale) superposed with streamlines of −RBϕBpol for the typical accretion process in simulation G101Dn5In4. Panels (a)–(f) correspond to Figures 4(a)–(f), respectively. A symmetrical logarithmic color scale is used, with the range from −10−3 to 10−3 shown in linear scale while the other parts in logarithmic scale. The black dashed lines indicate the contours of the critical density ﹩{\rho }_{{\rm{crit}}}=100\,{\rho }_{{\rm{\inf }}}﹩, aiding in the identification of the disk profile and delineating the transition between the two resistivity regimes (see Equation (9)). The violet dashed lines mark the boundaries where the azimuthal velocity reaches 80% of the Keplerian velocity, specifically, where ﹩{v}_{\phi }=0.8\sqrt{G{M}_{{\rm{pl}}}/r}﹩. For reference, the Keplerian timescale at the planetary radius (rpl = 0.0027 rH) is ﹩{{\rm{\Omega }}}_{{\rm{K}}}^{-1}({r}_{{\rm{pl}}})=1.4\times 1{0}^{-4}\,{{\rm{\Omega }}}_{{\rm{KH}}}^{-1}﹩.
Other Images in This Article
Show More
Copyright and Terms & Conditions
© 2026. The Author(s). Published by the American Astronomical Society.