Image Details
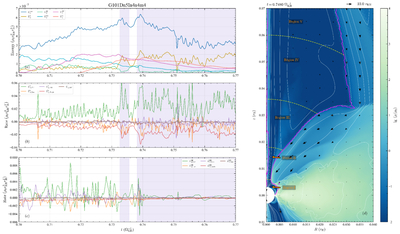
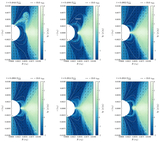
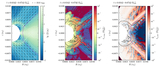
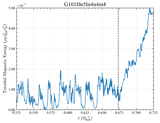
Caption: Figure 18.
Same as Figure 17, but focusing on the interval ﹩t=0.70\,\unicode{x02013}\,0.77\,{{\rm{\Omega }}}_{{\rm{KH}}}^{-1}﹩. Panel (a) additionally displays the time evolution of ﹩{U}_{\phi }^{{\rm{V}}}﹩, which represents the toroidal magnetic energy in the twisted magnetosphere at r > 0.06 rH. Purple shadings in panels (a)–(c) mark the active periods of the “pinch” mechanism (see the main text for details).
Other Images in This Article
Show More
Copyright and Terms & Conditions
© 2026. The Author(s). Published by the American Astronomical Society.
Copyright ©
2026 Astronomy Image Explorer. All Rights Reserved.