Image Details

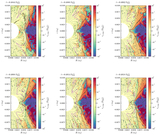
Caption: Figure 17.
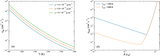
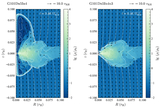
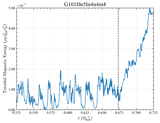
Time evolution of Uϕ, ﹩{\dot{U}}_{\phi ,{\rm{C}}F}﹩, ﹩{\dot{U}}_{\phi ,{\rm{L}}or}﹩, ﹩{\dot{U}}_{\phi ,{\rm{BD}}}﹩, ﹩{\dot{U}}_{\phi ,{\rm{J}}oule}﹩, and ﹩{\dot{U}}_{\phi ,{\rm{R}}F}﹩ within the different regions of the twisted upper-half magnetosphere for simulation G101Dn5In4n4m4, over the time range t = 0.65 to ﹩0.72\,{{\rm{\Omega }}}_{{\rm{KH}}}^{-1}﹩. The twisted upper-half magnetosphere is segmented into four radial regions, designated as Regions I, II, III, and IV, corresponding to the portions of the twisted upper-half magnetosphere located within r ≤ 0.006 rH, 0.006 rH < r ≤ 0.018 rH, 0.018 rH < r ≤ 0.036 rH, and 0.036 rH < r ≤ 0.06 rH, respectively. These regions at ﹩t=0.72\,{{\rm{\Omega }}}_{{\rm{KH}}}^{-1}﹩ are illustrated in panel (d), where density distribution (color scale), poloidal velocity field (black arrows), and magnetic field lines (solid white lines) are shown. The scale of the poloidal velocity is indicated at the top right of the panel. The magenta solid line delineates the twisted upper-half magnetosphere, where Bϕ/Bpol > 0.05, 4πρv2/B2 < 1.0, and θ < π/2. The yellow dashed lines crossing the magnetosphere delineate the boundaries between the radial regions. Panel (a) displays the time evolution of Uϕ for each defined region, with the region number labeled as a superscript (e.g., ﹩{U}_{\phi }^{{\rm{I}}}﹩ for Regions I, etc.), as well as for the entire twisted upper-half magnetosphere, denoted by the superscript “ms”. Panels (b) and (c) depict the time evolution of the energy change rates due to various physical mechanisms for Regions I and III, respectively, with the region number labeled as a superscript on each variable. The vertical dashed line in panels (a)–(c) marks the transition time separating the confined (left) and inflating (right) phases of the magnetosphere.
Other Images in This Article
Show More
Copyright and Terms & Conditions
© 2026. The Author(s). Published by the American Astronomical Society.