Image Details
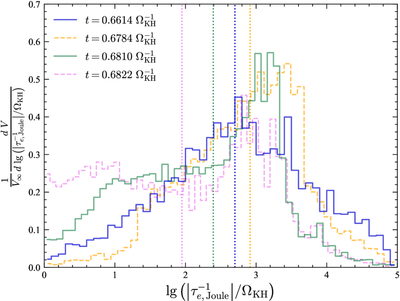
Caption: Figure 14.
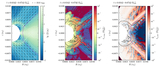
Volume fraction derivatives (VFDs) with respect to ﹩\mathrm{lg}\left(| {\tau }_{e,{\rm{Joule}}}^{-1}| /{{\rm{\Omega }}}_{{\rm{KH}}}\right)﹩ (see the text for definition). The blue and green solid lines represent VFDs at ﹩t=0.6614\,{{\rm{\Omega }}}_{{\rm{KH}}}^{-1}﹩ and ﹩0.6810\,{{\rm{\Omega }}}_{{\rm{KH}}}^{-1}﹩, corresponding to states shown in Figures 10 and 12, respectively. The orange and violet dashed lines show VFDs at two additional times, providing a broader view for the temporal evolution of the VFD. Vertical dotted lines, color-matched to their respective VFDs, mark the median values of ﹩\mathrm{lg}\left(| {\tau }_{e,{\rm{Joule}}}^{-1}| /{{\rm{\Omega }}}_{{\rm{KH}}}\right)﹩, with the volume fraction on each side of a line equal to 50%.
Other Images in This Article
Show More
Copyright and Terms & Conditions
© 2026. The Author(s). Published by the American Astronomical Society.