Image Details
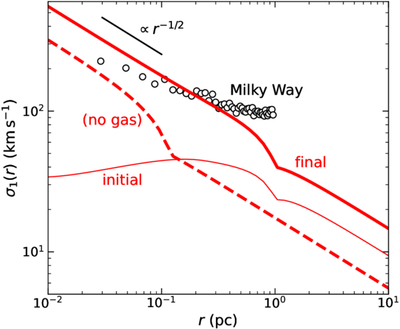
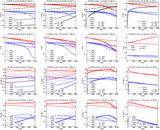
Caption: Figure 3.
Snapshots of the stellar velocity dispersion profile at t = 0 (initial, thin line) and t = 10 Gyr (final) with (thick solid) and without (thick dashed) gas accretion episodes. The black line segment shows the radius-dependent Keplerian circular velocity. Finally, the black hollow circles correspond to Milky Way data from R. Schödel et al. (2009).
Other Images in This Article
Copyright and Terms & Conditions
© 2026. The Author(s). Published by the American Astronomical Society.
Copyright ©
2026 Astronomy Image Explorer. All Rights Reserved.