Image Details
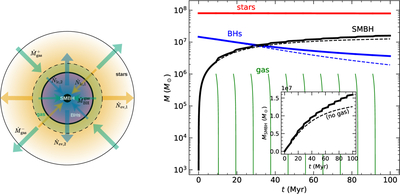
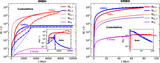
Caption: Figure 4.
Left: cartoon of the spherical cluster model developed in this work. The outer diffuse orange region bounded by the solid black line corresponds to the bulk stellar population, and the inner blue overdensity bounded by the thick black line is the subcluster of stellar-mass BH remnants (BHs) in the core surrounding a supermassive BH (SMBH) represented by the central solid black sphere. The faint green dashed sphere indicates the presence of ionized hydrogen gas in the system. The thin inward (thick outward) arrows show the loss-cone influx (evaporation outflux) of stars ﹩{\dot{N}}_{{\rm{lc}},{\rm{1}}}﹩ (﹩{\dot{N}}_{{\rm{ev}},{\rm{1}}}﹩) and BHs ﹩{\dot{N}}_{{\rm{lc}},{\rm{2}}}﹩ (﹩{\dot{N}}_{{\rm{ev}},{\rm{2}}}﹩). Finally, the green inward and green outward thick arrows show the influx ﹩{\dot{M}}_{{\rm{gas}}}^{+}﹩ and outflux ﹩{\dot{M}}_{{\rm{gas}}}^{-}﹩ of gas from the system, while the green inward thin arrows ﹩{\dot{M}}_{{\rm{BH}}}^{{\rm{gas}}}﹩ indicate gas accretion into the massive BH. Right: time evolution of the total stellar mass (red), total mass of stellar-mass BHs (blue), and mass of the massive BH (black). The dashed lines correspond to episodes of no gas inflow, while the solid green lines show gas inflow episodes. The inset shows the massive BH growth and the gas inflow episodes on a linear scale.
Other Images in This Article
Copyright and Terms & Conditions
© 2026. The Author(s). Published by the American Astronomical Society.