Image Details
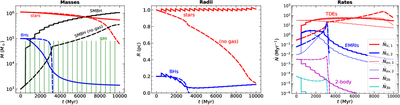
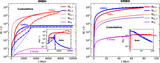
Caption: Figure 2.
Time evolution of the system shown in Figure 1 with (solid) and without (dashed) gas accretion. In the former scenario, 20 gas inflow episodes, each of 8 × 10⁴ M⊙ of gas, are added uniformly over time. Left: evolution of the total stellar mass (red), of the total mass in stellar-mass BHs (blue), and of the mass of the growing massive BH (black). The vertical green lines correspond to the episodes of gas inflow. Middle: evolution of the break radii of the stellar (red solid) and BH (blue solid) populations. Right: loss-cone (evaporation) rates for stars and BHs are the solid blue (thin solid blue) and solid red (thin solid red) lines, respectively. The magenta and cyan lines correspond to the formation rates of two-body and three-body stellar-mass binary BHs.
Other Images in This Article
Copyright and Terms & Conditions
© 2026. The Author(s). Published by the American Astronomical Society.