Image Details
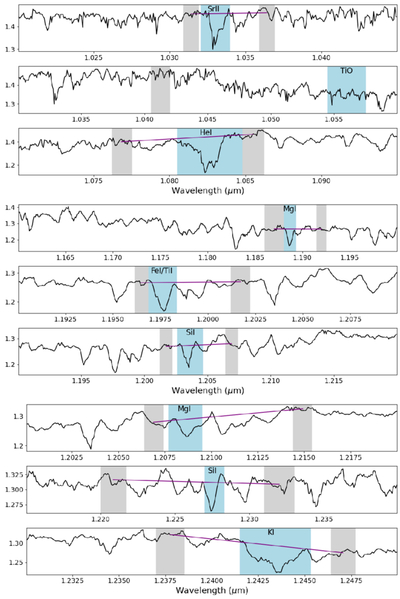
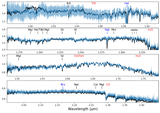
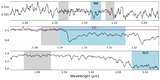
Caption: Figure 13.
Full collection of measured features shown against the median FUOr spectrum from Figure 5. The blue shaded area shows the measured region for each feature. The gray shaded area(s) show the nearby continuum region(s). The specific wavelength regions are defined in Table 1. Purple lines are the extrapolated continuum used for measuring the EWs.
Other Images in This Article
Show More
Copyright and Terms & Conditions
© 2026. The Author(s). Published by the American Astronomical Society.
Copyright ©
2026 Astronomy Image Explorer. All Rights Reserved.