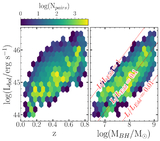
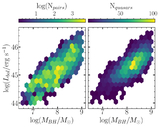
Image Details
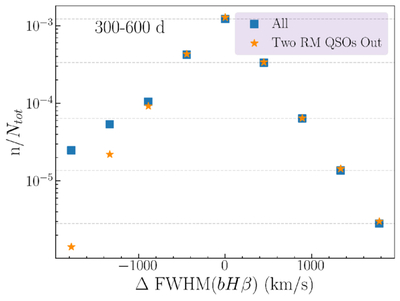
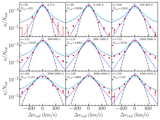
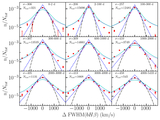
Caption: Figure 9.
Illustration of the effect of individual RM quasars on the observed asymmetry in the histograms for ΔFWHM(bHβ). Blue squares are a histogram for all pairs of observations (not just RM quasars) with rest-frame baselines between 300 and 600 days, created with the same method as in Figure 8. Horizontal lines are plotted at the values of the blue squares with ΔFWHM(bHβ) ≥ 0 to illustrate where the related points on the left side of the plot would lie if the distribution were symmetric. Orange stars are a histogram of the same sample with all of the pairs of observations from two RM quasars removed. These two quasars were hand selected for their predominantly negative values for ΔFWHM(bHβ). Removing these two RM quasars almost completely removes the asymmetry in ΔFWHM(bHβ).
Other Images in This Article
Copyright and Terms & Conditions
© 2026. The Author(s). Published by the American Astronomical Society.