Image Details
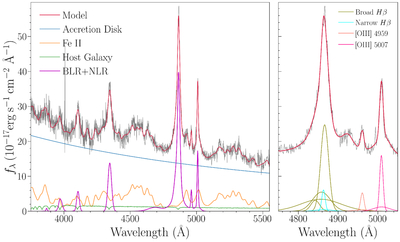
Caption: Figure 2.
An example spectral decomposition. Left: the data (gray) are shown with the total decomposition model (red). The model components include a power law for the accretion disk (blue), BLR and NLR emission lines (magenta), host galaxy template (green), and Fe II template (orange). Right: a zoom-in highlighting the Hβ region of the decomposition. The data (gray) and total model (red) are plotted along with the individual Gaussians that characterize [O III] λ5007 (pink), [O III] λ4959 (salmon), narrow Hβ (cyan), and broad Hβ (olive).
Other Images in This Article
Copyright and Terms & Conditions
© 2026. The Author(s). Published by the American Astronomical Society.
Copyright ©
2026 Astronomy Image Explorer. All Rights Reserved.