Image Details
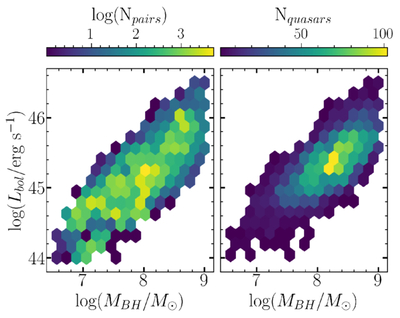
Caption: Figure 5.
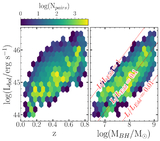
Left panel shows the number of pairs of spectra in our sample on a grid of bolometric luminosity and black hole mass. Right panel shows the number of quasars in our sample on the same grid. Because the RM subsample makes up the vast majority of pairs of spectra in our sample and a very small fraction of quasars in our sample, this plot also illustrates the differences in physical properties of the RM and non-RM subsamples.
Other Images in This Article
Copyright and Terms & Conditions
© 2026. The Author(s). Published by the American Astronomical Society.
Copyright ©
2026 Astronomy Image Explorer. All Rights Reserved.