Image Details
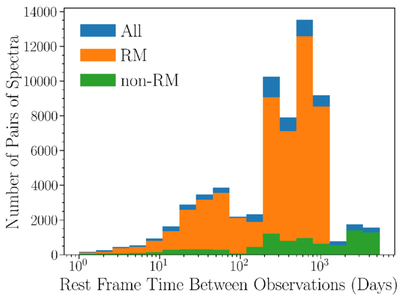
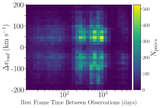
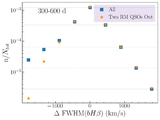
Caption: Figure 1.
The distribution of the pairs of spectral observations in our sample as a function of rest-frame time between observations. Also plotted are the histograms for the RM and non-RM subsamples. The RM-targeted pairs dominate the dataset for all but the longest baselines. This is the first sample large enough to statistically characterize BLR profile variability on timescales comparable to BLR dynamical times.
Other Images in This Article
Copyright and Terms & Conditions
© 2026. The Author(s). Published by the American Astronomical Society.
Copyright ©
2026 Astronomy Image Explorer. All Rights Reserved.