Image Details
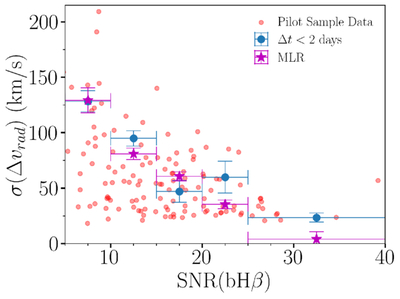
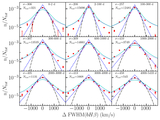
Caption: Figure 3.
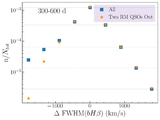
Estimates for the uncertainty in radial velocity jitter, σ(Δvrad). The multiple linear regression fit of σ(Δvrad) with SNR(bHβ) and Δvrad as the independent variables is plotted in purple. In order to represent the fit on a single independent variable, the sample was binned by SNR(bHβ) and the mean uncertainty value for each bin is plotted. Uncertainty estimates from the Δt < 2 days sample are plotted in blue. For both the MLR and Δt < 2 days plots, horizontal error bars represent the binning and the vertical error bars are estimated with the bootstrap method. The Δt < 2 days bins include 166, 93, 21, 34, and 12 pairs per bin, respectively, from low to high SNR.
Other Images in This Article
Copyright and Terms & Conditions
© 2026. The Author(s). Published by the American Astronomical Society.