Image Details
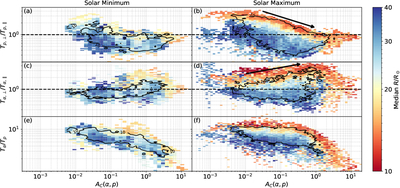
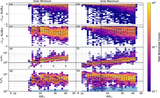
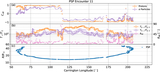
Caption: Figure 8.
Evolution of the temperature anisotropy and temperature ratio of α particles and protons with Coulomb collisional age AC(α, p). Temperature anisotropy of protons and α particles are shown in the top two rows, and Tα/Tp are shown in the bottom row. The two black arrows in panels (b) and (d) indicate the trends of ATp and ATα with AC(α, p) within 20 R⊙, respectively. The color bar indicates the heliocentric distance. The black contour denotes the counts of intervals in one bin equaling 10.
Other Images in This Article
Copyright and Terms & Conditions
© 2026. The Author(s). Published by the American Astronomical Society.
Copyright ©
2026 Astronomy Image Explorer. All Rights Reserved.