Image Details
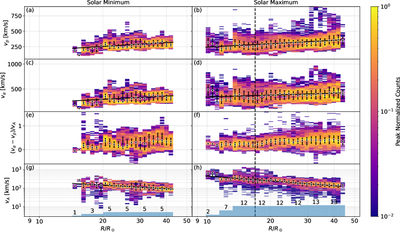
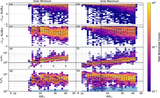
Caption: Figure 3.
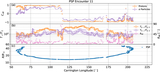
Radial evolution of vp, vα, differential speed between α particles and protons, and the Alfvén speed. Panels (a, b) show vp; panels (c), (d) show vα; panels (e), (f) show differential speed normalized to the Alfvén speed ((vα − vp)/vA); panels (g), (h) show the local Alfvén speed (vA). The left column corresponds to solar minimum; the right column corresponds to solar maximum. Black dots and error bars denote the median and interquartile range of local distributions in each bin. Solid lines are linear regression fits, represented as ﹩y=a{\mathrm{log}}_{10}x+b﹩, where x is R/R⊙, a is the slope, and b is the intercept. The fitted parameters are listed in Table 1. The vertical dashed line across the panels indicates the expected location of ACS based on the median vp. The light blue bars at the bottom of panels (e) and (f) show the number of PSP encounters in each heliocentric-distance bin.
Other Images in This Article
Copyright and Terms & Conditions
© 2026. The Author(s). Published by the American Astronomical Society.