Image Details
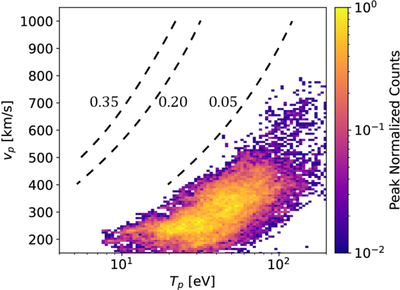
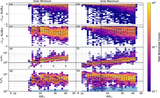
Caption: Figure 2.
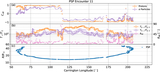
Overestimation of proton temperature and velocity. The color bar indicates normalized counts of intervals. The dashed curves, representing ﹩{\mathrm{log}}_{10}﹩ (Tout/Tf), are from Figure 6c in G. Nicolaou et al. (2025). For easy comparison, eV is used as the unit of temperature here.
Other Images in This Article
Copyright and Terms & Conditions
© 2026. The Author(s). Published by the American Astronomical Society.
Copyright ©
2026 Astronomy Image Explorer. All Rights Reserved.