Image Details
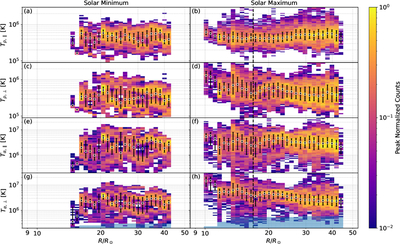
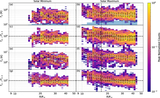
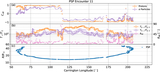
Caption: Figure 7.
Radial evolution of the parallel and perpendicular components of proton and α particle temperature. Tp∥ and Tp⊥ are shown in the top row and the second row. The left column is for solar minimum. The right column is for the solar maximum of solar activity. Tα∥ and Tα⊥ are shown in the third row and the bottom row.
Other Images in This Article
Copyright and Terms & Conditions
© 2026. The Author(s). Published by the American Astronomical Society.
Copyright ©
2026 Astronomy Image Explorer. All Rights Reserved.