Image Details
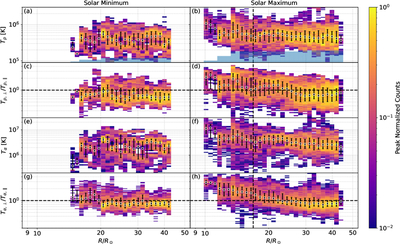
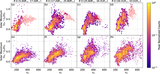
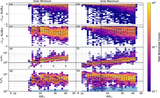
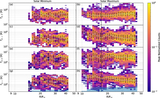
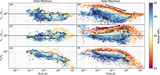
Caption: Figure 6.
Radial evolution of the temperature and temperature anisotropy of protons and α particles. Tp and Tp⊥/Tp∥ are shown in the top row and the second row. The left column is for solar minimum. The right column is for the solar maximum of solar activity. Tα and Tα⊥/Tα∥ are shown in the third row and the bottom row. The bold dashed horizontal line represents T⊥/T∥ = 1.
Other Images in This Article
Copyright and Terms & Conditions
© 2026. The Author(s). Published by the American Astronomical Society.
Copyright ©
2026 Astronomy Image Explorer. All Rights Reserved.