Image Details
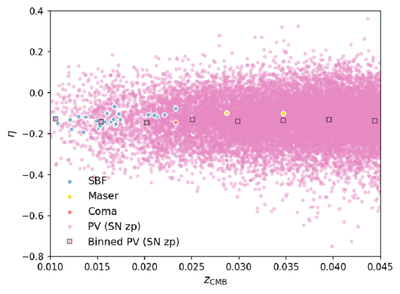
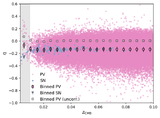
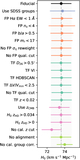
Caption: Figure 9.
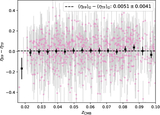
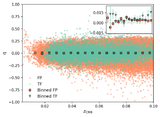
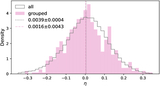
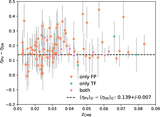
Alternative calibrators compared to the DESI log-distance ratio Hubble diagram. The white-outlined circles represent each calibrator, and the DESI PV values (pink circles, squares) are displayed on the SN zero-point for comparison.
Other Images in This Article
Show More
Copyright and Terms & Conditions
© 2026. The Author(s). Published by the American Astronomical Society.
Copyright ©
2026 Astronomy Image Explorer. All Rights Reserved.