Image Details
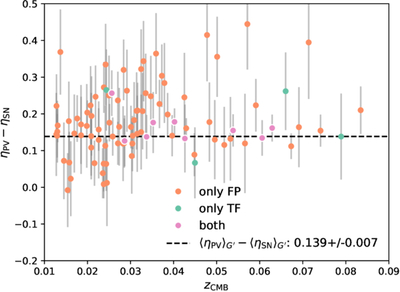
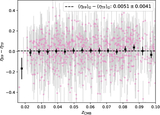
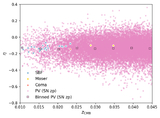
Caption: Figure 7.
The difference between the log-distance ratio given by DESI and Pantheon+ SNe Ia for individual groups (for visualization only). The average difference between the two is the zero-point (black dashed line). We shift the DESI PV sample to match the SN.
Other Images in This Article
Show More
Copyright and Terms & Conditions
© 2026. The Author(s). Published by the American Astronomical Society.
Copyright ©
2026 Astronomy Image Explorer. All Rights Reserved.