Image Details
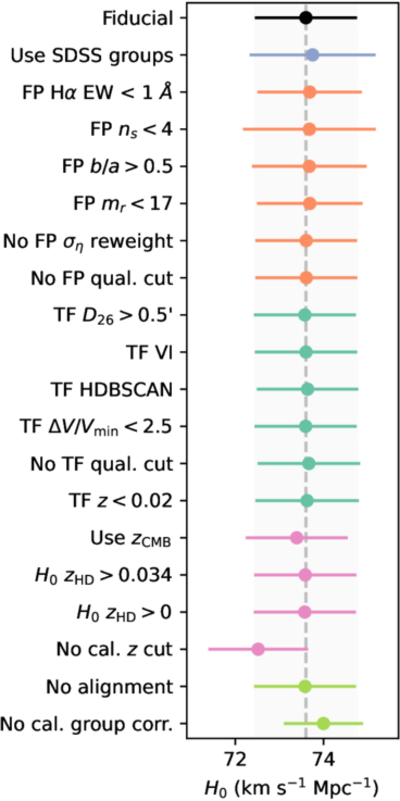
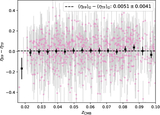
Caption: Figure 10.
Whisker plot of all systematic tests. Each point corresponds to a single change to the fiducial zero-pointing and H0 fitting pipeline. The black point, gray-shaded region, and gray dashed line all represent the fiducial measurement, and each color corresponds to the systematic group described in Sections 6.1.1 to 6.1.5. The weighted standard deviation of all tests results in ﹩{\sigma }_{{H}_{0}}\ \,\rm{(syst.)}\,=0.29﹩ km s−1 Mpc−1.
Other Images in This Article
Show More
Copyright and Terms & Conditions
© 2026. The Author(s). Published by the American Astronomical Society.
Copyright ©
2026 Astronomy Image Explorer. All Rights Reserved.