Image Details
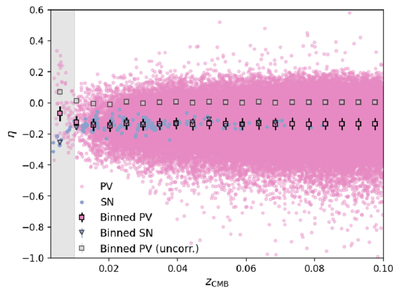
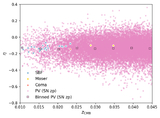
Caption: Figure 8.
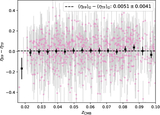
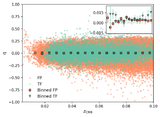
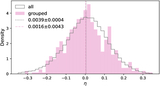
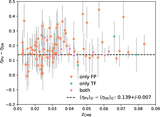
Combined TF+FP (PV) log-distance ratio Hubble diagram with Pantheon+ SNe Ia. The DESI PV log-distance ratios (pink circles, squares) have been shifted to the SN Ia (blue circles, triangles) zero-point. The binned, uncorrected DESI η (gray squares) are displayed for comparison. The shaded region (z < 0.01) was excluded from the zero-point fit because the calibrators and DESI sample show disagreement.
Other Images in This Article
Show More
Copyright and Terms & Conditions
© 2026. The Author(s). Published by the American Astronomical Society.
Copyright ©
2026 Astronomy Image Explorer. All Rights Reserved.