Image Details
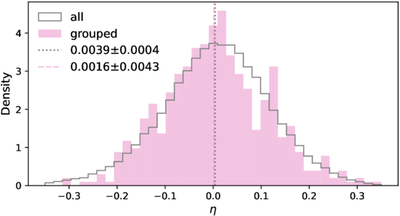
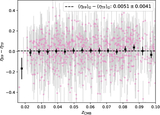
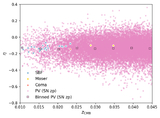
Caption: Figure 6.
Comparison of the distributions of all DESI PV η (gray) and of the galaxies in groups with SNe (pink). The means (dashed lines) disagree by <1σ, but the K-S test still shows some evidence that they are different distributions.
Other Images in This Article
Show More
Copyright and Terms & Conditions
© 2026. The Author(s). Published by the American Astronomical Society.
Copyright ©
2026 Astronomy Image Explorer. All Rights Reserved.