Image Details
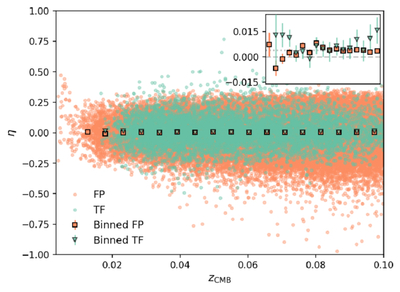
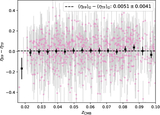
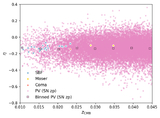
Caption: Figure 5.
“Hubble diagram” in η, which shows Hubble residuals as a function of redshift. We expect it to be flat in z, and centered on 0 when we use the same fiducial cosmology as was used to generate the catalogs. The inset axes zoom in to η = 0 (gray dashed line); the mean (gray dotted line) is actually offset slightly, as already shown by the gray dotted line in Figure 3.
Other Images in This Article
Show More
Copyright and Terms & Conditions
© 2026. The Author(s). Published by the American Astronomical Society.
Copyright ©
2026 Astronomy Image Explorer. All Rights Reserved.