

Image Details
Caption: Figure 9.
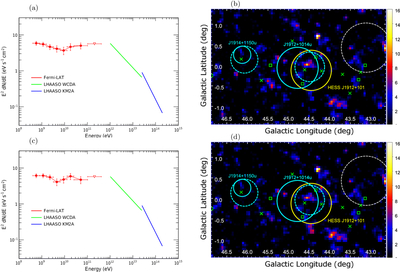
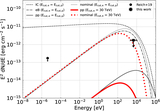
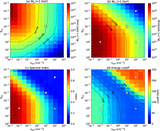
(a) Fermi-LAT GeV spectrum of the LHAASO/H.E.S.S. source counterpart (red points) obtained using the Y. Su et al. (2017) Np map (with a radius of ﹩0\mathop{.}\limits^{^\circ }87﹩) as a template. The best-fit spectral models for LHAASO J1912+1014u in Z. Cao et al. (2024) are also plotted. (b) The TS map in ≥12.8 GeV obtained using the Y. Su et al. (2017) Np map. (c) and (d) are the same as panels (a) and (b), respectively, but obtained using LHAASO KM2A Gaussian.
Other Images in This Article
Copyright and Terms & Conditions
© 2026. The Author(s). Published by the American Astronomical Society.

Copyright ©
2026 Astronomy Image Explorer. All Rights Reserved.
