

Image Details
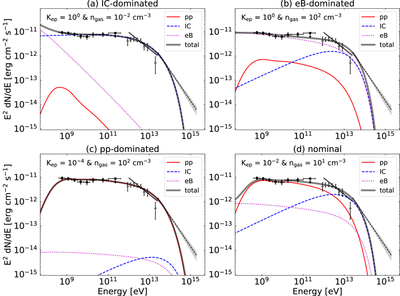
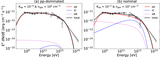
Caption: Figure 4.
SED fit results for four representative Kep-ngas parameter sets, assuming no electron cooling. (a) IC-dominated case with (Kep, ngas) = (100, 10−2 cm−3), (b) eB-dominated case with (Kep, ngas) = (100, 102 cm−3), (c) pp-dominated case with (Kep, ngas) = (10−4, 102 cm−3), and (d) nominal case with (Kep, ngas) = (10−2, 101 cm−3). In each panel, the filled squares and open triangles represent the spectrum in the Fermi band (this work) and the H.E.S.S. band (H.E.S.S. Collaboration et al. 2018b), respectively. The line segments show the reported spectrum by LHAASO (WCDA: 1–25 TeV; KM2A: 25–200 TeV). Although we account for the HAWC spectrum in the SED fitting, we do not show it (very close to the WCDA spectrum) for clarity. The red solid, blue dashed, magenta dotted, and thick black solid lines represent the spectra of pp, IC, eB, and total γ-ray emission, respectively.
Other Images in This Article
Copyright and Terms & Conditions
© 2026. The Author(s). Published by the American Astronomical Society.

