

Image Details
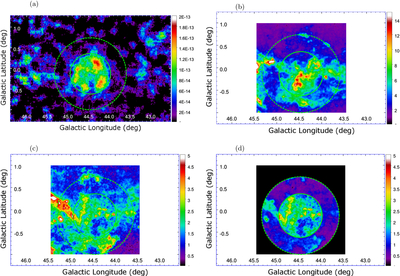
Caption: Figure 2.
Template maps tested to reproduce the GeV excess emission toward the LHAASO/H.E.S.S. source. (a) The H.E.S.S. intensity map. (b) The Np map of Y. Su et al. (2017) velocity range (58.4–62.2 km s−1). (c) The Np map of H. Sano et al. (2018) velocity range (23.2–26.4 km s−1). (d) The same as (c), but Np in the annulus is scaled by 1/2.10 (see the text for details). There, the solid circle (with a radius of ﹩0\mathop{.}\limits^{^\circ }49﹩; the same as the yellow circle in Figure 1) shows the size of the spherical shell of HESS J1912+101 used in the initial modeling, and the dashed circle (with a radius of ﹩0\mathop{.}\limits^{^\circ }87﹩) shows the area used in the final modeling. The H.E.S.S. intensity map is arbitrarily scaled to be compatible with Fermitools. The unit of Np maps is 1021 cm−2.
Other Images in This Article
Copyright and Terms & Conditions
© 2026. The Author(s). Published by the American Astronomical Society.

