

Image Details
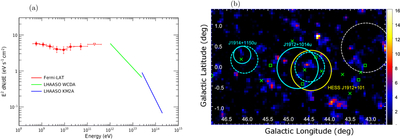
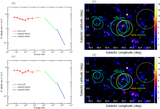
Caption: Figure 3.
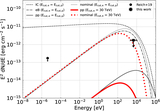
(a) Fermi-LAT GeV spectrum of the LHAASO/H.E.S.S. source counterpart (red points) obtained using the H. Sano et al. (2018) Np map (with a radius of ﹩0\mathop{.}\limits^{^\circ }87﹩) as a template. The best-fit spectral models for LHAASO J1912+1014u, as reported by Z. Cao et al. (2024), are also plotted. (b) The TS map in ≥12.8 GeV obtained using the H. Sano et al. (2018) Np map.
Other Images in This Article
Copyright and Terms & Conditions
© 2026. The Author(s). Published by the American Astronomical Society.

Copyright ©
2026 Astronomy Image Explorer. All Rights Reserved.
