

Image Details
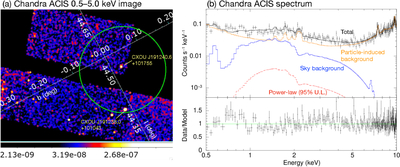
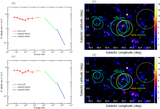
Caption: Figure 7.
(a) A 0.5–5.0 keV Chandra image and (b) energy spectrum with the best-fit spectral model. The spectrum was extracted from the green circle in panel (a). The blue, orange, and black lines indicate the sky background, particle-induced background, and total model, respectively. The upper limit for the power-law component, used as the counterpart to the γ-ray excess, is shown by the red dashed line.
Other Images in This Article
Copyright and Terms & Conditions
© 2026. The Author(s). Published by the American Astronomical Society.

Copyright ©
2026 Astronomy Image Explorer. All Rights Reserved.
