Image Details
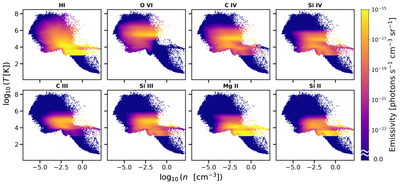
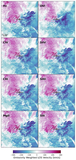
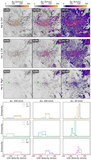
Caption: Figure 17.
2D histograms showing the emissivity distribution of each ion as a function of gas temperature and number density for the Maelstrom halo at z = 0.5. The dark blue background indicates all gas, while the colored pixels highlight regions where emission from that ion is present. The sharp cutoff at ﹩{\mathrm{log}}_{10}T=3﹩ arises because the minimum temperature included in the CLOUDY emissivity tables is ﹩{\mathrm{log}}_{10}T=3﹩, as this is the minimum temperature we expect to find in the CGM and we do not focus on ISM emission in this work.
Other Images in This Article
Show More
Copyright and Terms & Conditions
© 2026. The Author(s). Published by the American Astronomical Society.
Copyright ©
2026 Astronomy Image Explorer. All Rights Reserved.