Image Details
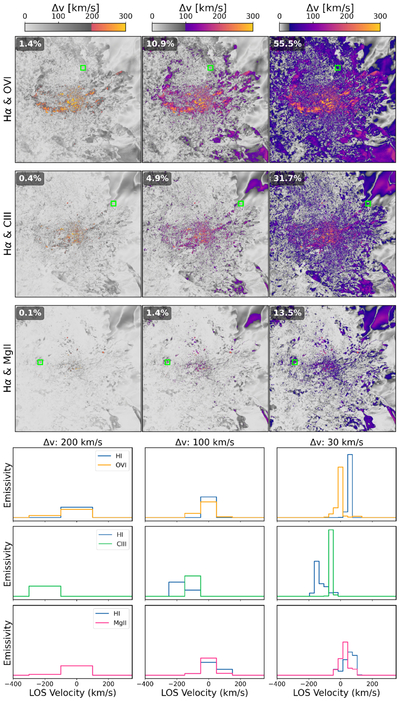
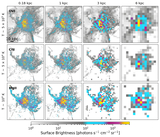
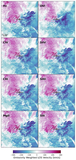
Caption: Figure 8.
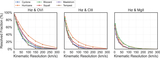
Velocity differences between Hα and O VI, C III, and Mg II in the Cyclone halo. Top: maps show where emissivity-weighted velocity differences exceed kinematic resolution thresholds (200, 100, 30 km s−1). Gray pixels are unresolved; colored pixels are kinematically distinguishable. Percentages in the top left of each panel indicate the fraction of the area with resolved kinematic differences (i.e., colored pixels divided by total area). Bottom: normalized velocity profiles along the selected sightlines (marked by green boxes in the top panels). Each column corresponds to the same sightline across resolution levels. These profiles highlight how improved spectral resolution enables clearer separation between the velocity structures of different ions.
Other Images in This Article
Show More
Copyright and Terms & Conditions
© 2026. The Author(s). Published by the American Astronomical Society.